Analysis Period
Defining the right analysis period
Choosing the right analysis period
1817 / 1850 / 1888 / 1981 / 1983
If you look at graphics of the lake’s annual course, the course of the maximum varies considerably in some cases. This is due to different definitions of the analysis period for determining the long-term values. Here is an overview of the different approaches that I am currently aware of:
1817. Basically, the LUBW provides measured values for the station in Konstanz from 1817 onwards. However, these very early data are problematic and are not used in any graphical elaboration.
1850. On the bodensee-hochwasser.info page of the LUBW flood center you can find a representation of the current water level in Konstanz under “W annual cycle” –> “Konstanz”, which shows the period of for the max and min values 1850 to 2021 taken into account.
1888. For the ebene-konstanz.de website I decided to take the data from 1888 into account. The reason for this decision is a publication by the LUBW, which can be found at https://pudi.lubw.de/detailseite/-/publication/53660. This is entitled: “Long-term behavior of Lake Constance water levels”. Subtitle: “Evaluation period: 1888 to 2007” And that is exactly the topic. The study seems complex and trustworthy to me. However, I haven’t read it completely. However, there is a chapter in this publication on the data basis and data selection in which the data quality of various sources is weighed up. Here it says:
*…] Therefore, only these levels are included in the present study and, after the consistency and homogeneity check (Section 3.2), are evaluated uniformly over the 120-year period from 1888 to 2007. […]
1981. At the end of 2022, the LUBW flood center has the period of the analysis on its website. Adapted from 1981 to 2021. Previously, the period from 1850 was also used here. When I asked, it was explained to me that this step was taken primarily for standardization. I can understand that. However, it is of course a shame if you have a lot more data and then don’t use it.
1983. The hourly average values used to calculate the daily maximum are actually only available from November 1982. The underlying data is downloadable from 1817. However, the first different values on a day only appear from 1982-11-01 (apart from four outliers: 1855-04-23, 1855-06-06, 1857-04-26, 1857-04-27, but data is never perfect). For the analysis below, we ignore this aspect.
Graphical comparison
Here is a graphical comparison of the different time periods.
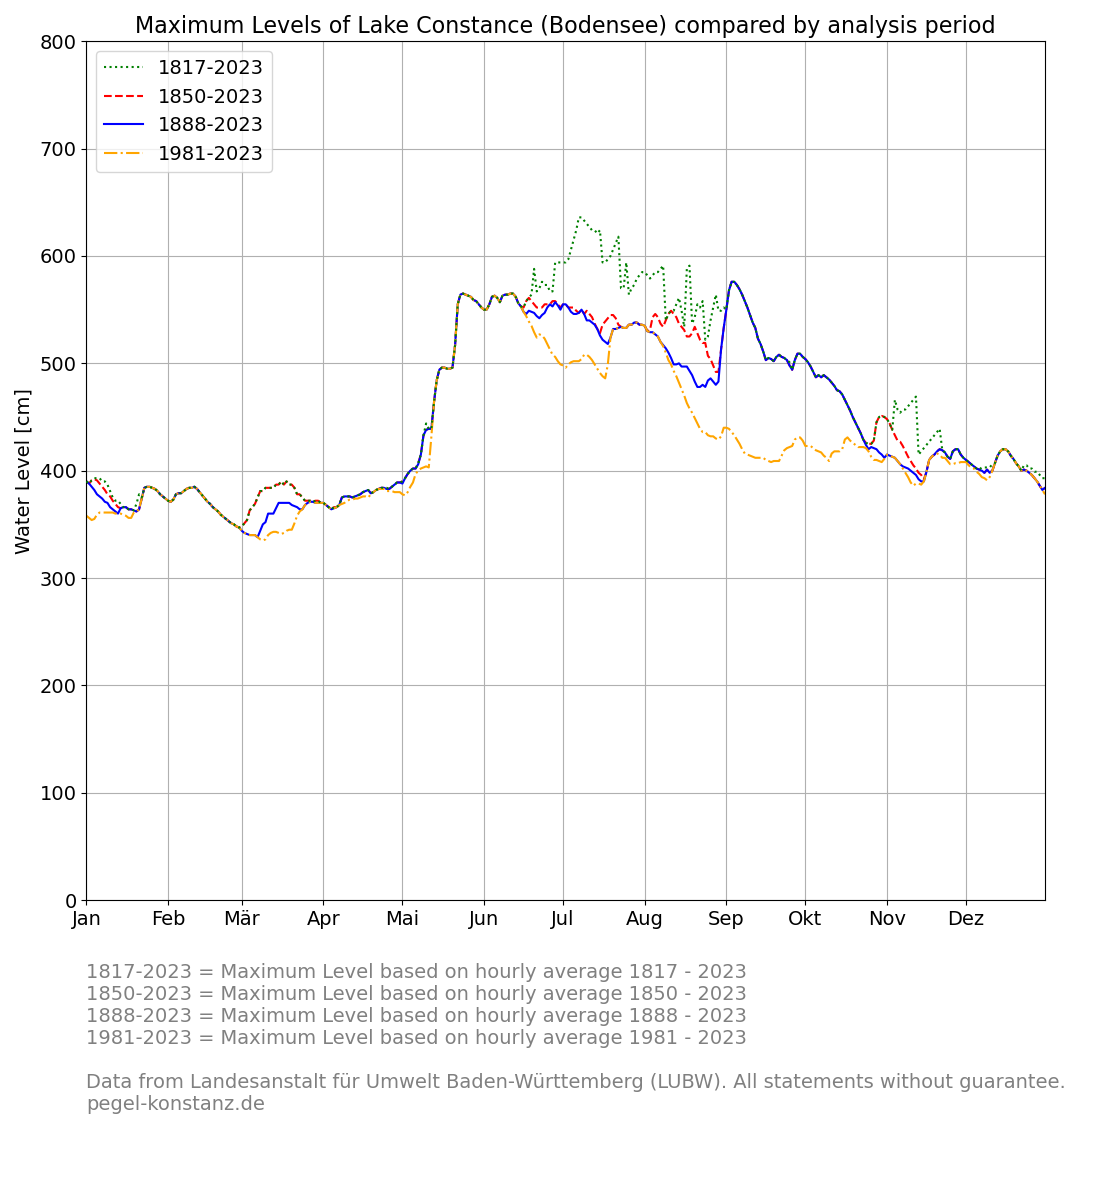
Maximumum
First the maximum: This is of course where the differences are most clearly visible. The data from 1817 onwards is a mixed bag. And that doesn’t seem very credible. The flood of 1889 is particularly noticeable if you choose a corresponding period.
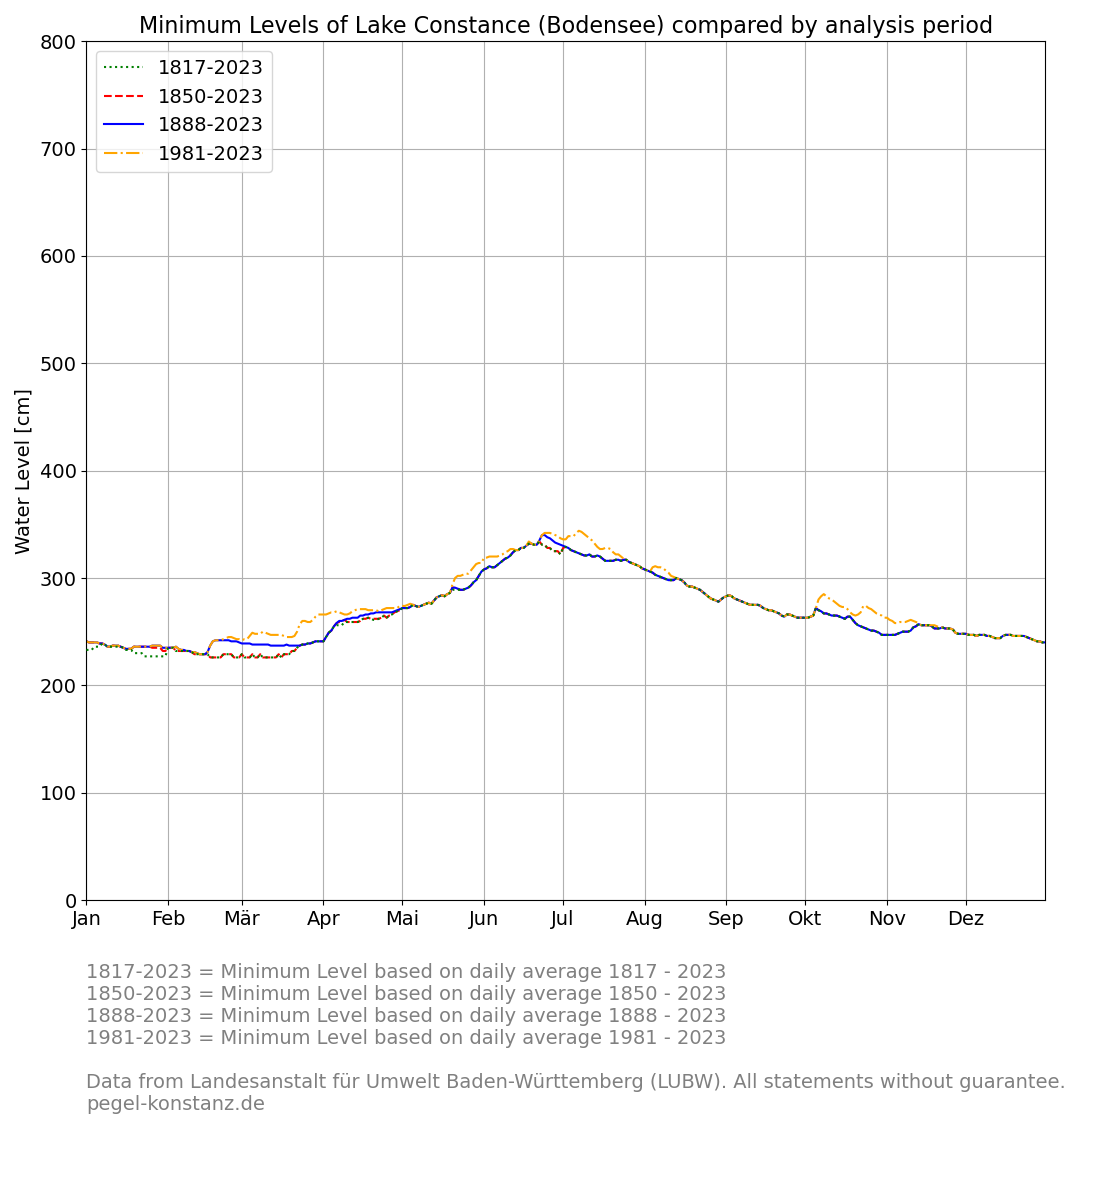
Minimum
As expected, there are only very small differences in the minimum.
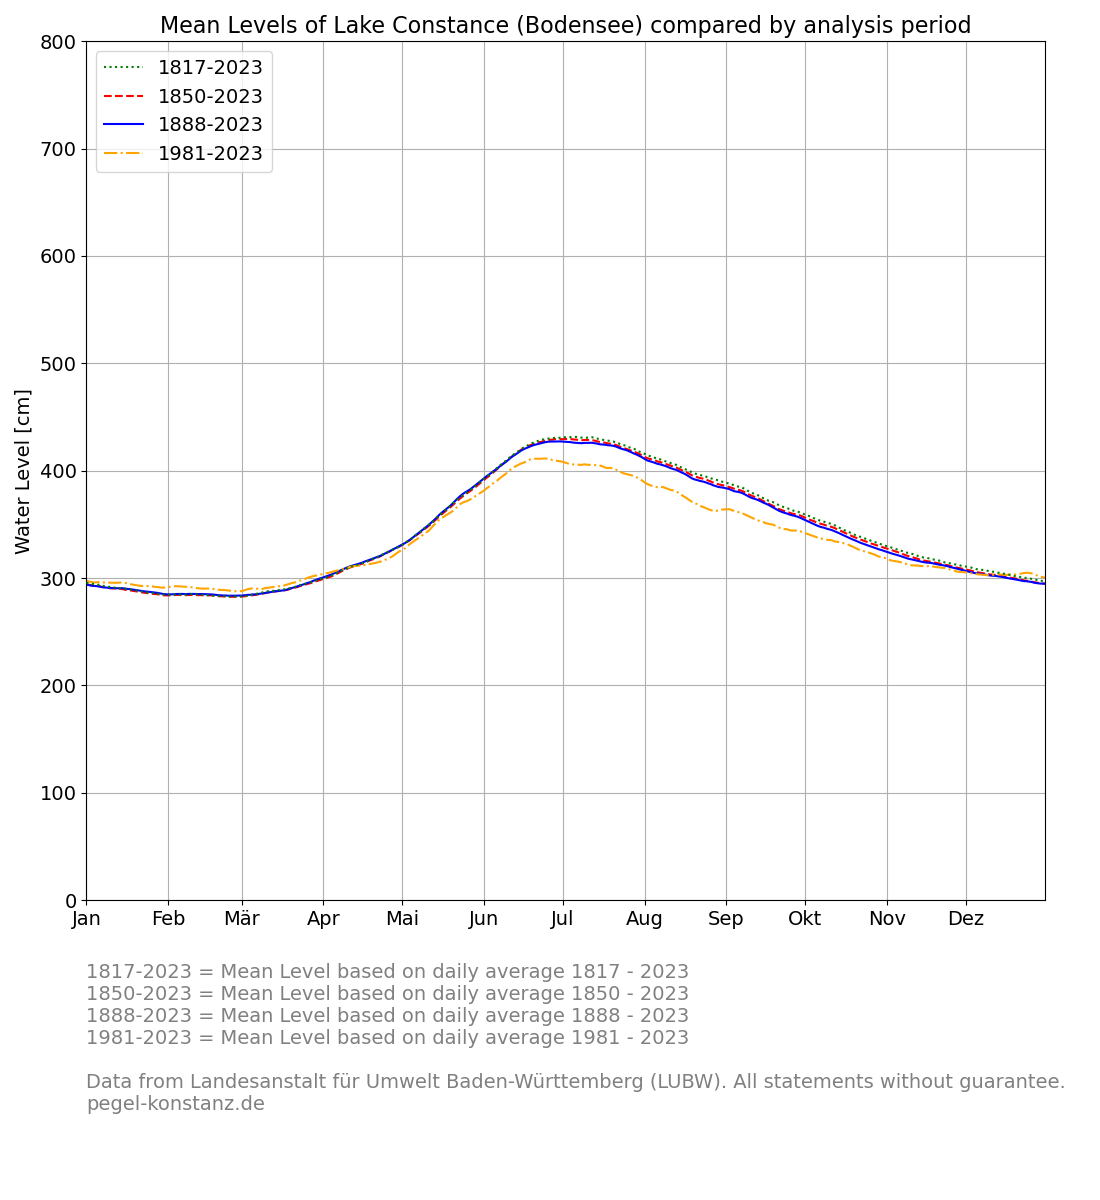
Medium
I was very surprised by the significant shift in the mean value over a very short analysis period in 1981. The data indicates that the level of the lake during summer is significantly lower nowerdays.